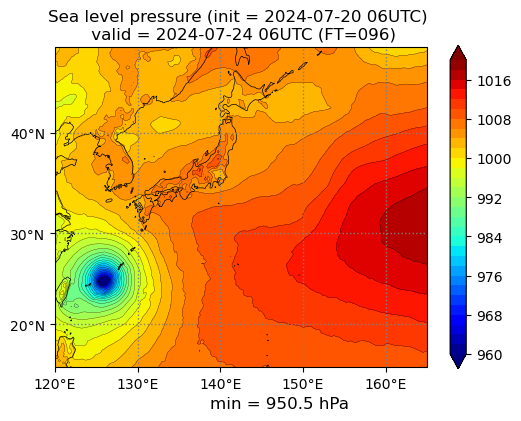
数値予報の計算結果はFTが長くなれば不確実性が大きくなりますのでご利用の際には注意いただきたいですが、結果を素朴に描画してみたいという場合には別に構わないでしょう。ここでは地上天気図のように海面更正気圧の等値線を描画するコードを紹介してみたいと思います。今回、描画対象時刻に台風が存在していますが、台風の進路予測は決定論予測だけでは当然測れませんので、気象庁が発表する台風情報をご参照ください。

# -*- coding: utf-8 -*-
import pygrib
import numpy as np
import matplotlib.pyplot as plt
import matplotlib.ticker as mticker
from mpl_toolkits.axes_grid1 import make_axes_locatable
import cartopy.crs as ccrs
from cartopy.mpl.ticker import LongitudeFormatter, LatitudeFormatter
from datetime import datetime, timedelta
import subprocess

init = "2024 07 20 06 00" # UTC
ft = 96
lon1 = 120; lon2 = 165; lat1 = 15; lat2 = 47.6
levels = np.arange(960,1021,2)

# GFSデータをダウンロードする
year, month, day, hour, _ = init.split()
url = f"https://nomads.ncep.noaa.gov/pub/data/nccf/com/gfs/prod/gfs.{year}{month}{day}/{hour}/atmos/gfs.t{hour}z.pgrb2.0p25.f{ft:03d}"
print(url)
subprocess.run(["wget","-N", url])

# ファイルオープン
f = pygrib.open("gfs.t06z.pgrb2.0p25.f{:003}".format(ft))
g = f.message(1) # Sea level pressure
pres,lats,lons = g.data(lon1=lon1,lon2=lon2,lat1=lat1,lat2=lat2)
pres = pres/100 # Pa->hPa

dt1 = datetime.strptime(init, "%Y %m %d %H %M")
dt2 = dt1 + timedelta(hours=ft)
vdt1 = dt1.strftime("init = %Y-%m-%d %HUTC")
vdt2 = dt2.strftime("valid = %Y-%m-%d %HUTC (FT={:003})").format(ft)
pngfile = dt1.strftime("init_%Y%m%d_%HUTC_FT{:003}").format(ft)
print(vdt1)
print(vdt2)

fig = plt.figure(figsize=(6,6))
ax = fig.add_subplot(1,1,1,projection=ccrs.Mercator(central_longitude=135))
ax.coastlines(resolution='50m', lw=0.5)
xticks = np.arange(110,171,10)
yticks = np.arange(10,61,10)
ax.set_xticks(xticks, crs=ccrs.PlateCarree())
ax.set_yticks(yticks, crs=ccrs.PlateCarree())
ax.set_xticklabels(xticks)
ax.set_yticklabels(yticks)
lon_formatter = LongitudeFormatter(zero_direction_label=True)
lat_formatter = LatitudeFormatter()
ax.xaxis.set_major_formatter(lon_formatter)
ax.yaxis.set_major_formatter(lat_formatter)

gl = ax.gridlines(crs=ccrs.PlateCarree(),linestyle=':',
                  color='gray',linewidth=1)
gl.xlocator = mticker.FixedLocator(xticks)
gl.ylocator = mticker.FixedLocator(yticks)

im = ax.contourf(lons,lats,pres,levels,cmap="jet",
                 extend="both",transform=ccrs.PlateCarree())
ax.contour(lons,lats,pres,levels,colors=["black"],linewidths=0.2,
           transform=ccrs.PlateCarree())

plt.colorbar(im,ax=ax,shrink=0.7)
ax.set_title("Sea level pressure ({}) \n {}".format(vdt1,vdt2))
plt.suptitle("min = {:.1f} hPa".format(pres.min()), y=0.18)

plt.savefig(pngfile,bbox_inches="tight")
plt.close